Picture this: In the vibrant atmosphere at our recent conference, a question danced on everyone’s lips:
Our answer to this is a mix of “yes” and “no.” At Caplena, we primarily use our custom AI model for core tasks and ChatGPT for the summarization feature. Drawing a parallel between Caplena and ChatGPT in text analysis might seem like a riddle wrapped in a mystery. But it’s more like contrasting a powerful motor with a cutting-edge vehicle. Each comes with a unique prowess and purpose, aptly suiting distinct scenarios. But are they identical twins in the AI family? A resounding ‘no’ rings clear. Let’s delve into the reasons why👇.
ChatGPT, along with its GPT4 version, is a powerful tool, providing human-like responses to a broad array of questions. In contrast, Caplena, a feedback analysis platform, uses a specific AI model optimized for the task of categorizing large amounts of text data into distinct topics. Naturally, the question arises as to which tool offers a more effective analysis of customer feedback. In this study, we aim to compare the task of accurately categorizing sentences into relevant topics.
To effectively compare Caplena and ChatGPT, we first need to define the task we’re evaluating. Our focus here is the process of topic assignment. Given a predefined set of topics, our goal is to determine their frequency of appearance in user feedback. To accomplish this, the AI needs to categorize each text into one or more relevant topics.
The fundamental difference between Caplena and ChatGPT in topic assignment is that Caplena takes a direct approach, focusing specifically on topic assignment as its core task.
On the other hand, ChatGPT operates in a chat-like format, designed for engaging and interactive conversations. While ChatGPT can understand and respond to various questions, its primary objective is not that of topic assignment. Instead, ChatGPT aims to generate human-like responses, making it indirectly capable of addressing the task of topic assignment in the conversation.
When comparing the user interfaces of ChatGPT and Caplena, ChatGPT utilizes a chat interface for receiving and generating conversational responses. Categorizing topics within sentences requires constructing a prompt in the form of a conversation, rather than directly inputting the text. Crafting a comprehensive prompt becomes crucial in ChatGPT’s approach. Let’s take a look at an example of how a prompt similar to this one might appear:


In our experiment, ChatGPT and Caplena went head-to-head, pitted against each other using a test dataset of 22 surveys. We employed the F1 score as our primary evaluation metric to assess the model’s accuracy on a scale of 0% to 100%. This metric measures how well the model aligns with a human-annotated dataset considering both precision and recall, which helps handle the uneven class distribution.
Our evaluation revealed that, overall, Caplena’s AI delivered superior accuracy. However, there were four instances where ChatGPT took the lead as illustrated below. Calculating the average F1 score across all 22 surveys, ChatGPT clocked in at 44%. Caplena’s AI scored a higher average of 56%. For reference, a naive model that randomly guesses will typically achieve an F1 score of approximately 5%. This difference is noteworthy despite a high degree of variance within the dataset. Although the numbers may seem similar at first glance, Caplena takes an additional step that significantly increases the percentage from 56%.

Caplena’s standout feature lies in its remarkable fine-tuning capability. This enables a significant improvement from an initial F1 score of 56% to an ambitious target of 70% or higher. As mentioned earlier, a naive model that randomly guesses will typically achieve an F1 score of approximately 5%. A study by Ishita, Oard, and Fleischmann found that a fully manual human analysis only achieved an F1 score of 62.7%. This proves that humans are not infallible coders. Achieving a score of 70% places Caplena’s precision analysis on par with – or surpasses – a human-level performance. While the initial score of 56% shows good performance in many scenarios, it falls short of human accuracy. Especially in more complex scenarios like lengthy reviews or topics with semantic overlaps.
To overcome these challenges, we have implemented a streamlined process that actively involves users. In this process, users validate model outputs for a small subset of the dataset. Specifically, users review whether Caplena’s categorization is correct or incorrect for a select number of test cases. Working with the AI usually involves a couple of dozen rows. The manually validated data is then used to fine-tune the model to the specific task of the user, improving the model’s score on average from 56% to 66% in our setting, ensuring that it aligns with the user’s requirements.
To maintain transparency in our performance metrics, we use a portion of the human-validated data as a test set to estimate the F1 score. This evaluation method allows users to gauge the accuracy of the Caplena analysis. Users can monitor the evolution of their F1 score in real-time, providing insights into the model’s performance. We recommend considering an F1 score of 65 – 70 to indicate satisfactory accuracy. For a fair comparison, we used manually validated samples to also enhance ChatGPT. In particular, we employed a technique called few-shot learning. This involves including some examples with solutions in the prompt. However, ChatGPT struggled to benefit from this extra information in the prompts. This resulted in a decrease in ChatGPTs overall score from 44% to 41%.

Our study encountered challenges due to ChatGPT’s prompt size constraint. This limited the number of verified samples that could be included in the few-shots learning prompt and hindered a higher F1 score. Thus, we had to cap Caplena’s F1 score at 66%, while ChatGPT achieved 41%, ensuring fairness in the experiment. However, it should be noted that Caplena can achieve scores of 70 and above in real-life applications.
Even without few-shot learning, we observed that ChatGPT struggles with very long prompts. While the hard limit of 3000 words in ChatGPT was sufficient to analyze all the surveys in our sample, we noticed a decline in performance when analyzing questions covering a wide range of topics. In contrast, Caplena’s model, specifically trained for this task, does not suffer from this issue in surveys with many diverse topics.
Fortunately, the successor model, GPT4, is capable of handling much longer sequences, up to 20,000 words. This development has us excited to test it out. However, at present, the API for GPT4 is slow, and frequent lockouts occur due to the high volume of requests. We eagerly anticipate analyzing the model in the future.
Also, there were instances where ChatGPT struggled to interpret our prompts correctly. This resulted in responses like:
“Cannot classify the 35th review as it seems to be incomplete or unrelated to the topic list.”
“Little confused by this review, it doesn't seem to provide enough information to assign a topic. Can you provide more context or information to help me understand the review better?”
“1,2,3 all have [TOPIC]” (when multiple reviews are included in a prompt).
In sum: Caplena outperforms ChatGPT in the precisely defined text analysis tasks of topic assignment. Now, let’s unpack other elements contributing to Caplena’s unrivaled performance in the task of assigning topics to text.
ChatGPT excels in text summarization, understanding and responding in a human-like manner to various prompts. Still, it is crucial to acknowledge its limitations in analyzing quantitative customer feedback topics. ChatGPT’s summarization feature is impressive, but it should not replace a comprehensive and precise textual analysis for optimal results.
During this ongoing beta testing phase, we are effectively combining the best of both worlds. Caplena carries out the precise analysis, and ChatGPT provides a concise summary of the analyzed data. With this combination, one can quickly obtain a data overview in a few sentences, accessible with a single click. This ensures efficiency and a user-friendly experience, streamlining the data analysis process.
To wrap up, Caplena stands out as the superior choice for customer feedback analysis over ChatGPT for several key reasons:
ChatGPT is an innovative AI tool that excels in generating human-like responses and offering contextual information. However, it is important to recognize both the strengths and limitations of ChatGPT. In the specific task of determining topics and their frequency of appearance in user feedback, Caplena clearly excelled. Caplena achieved an impressive overall score of 66%, surpassing ChatGPT’s 41% F1 score. Without the limitations imposed by this study, Caplena has the potential to achieve scores well beyond 70%, reaching above-average human-level accuracy. This is not surprising, given its purposeful design for the task, while ChatGPT serves a different use case.
Having said that, Caplena and ChatGPT are not in opposition; they complement each other. By integrating ChatGPT’s summarization feature into Caplena’s dashboard, users can leverage the strengths of both tools. This allows for valuable insights, utilizing powerful text analytics and visualization tools. This collaboration bridges the gap between sophisticated language models and advanced text analysis, expanding the boundaries of what can be achieved in this field.
So, is it really an “us vs them” question?
No. It’s an “us and them” opportunity for innovation and progress in the realm of text analytics.
Yes! Your customer review analysis was a success. You’ve asked the right questions, gathered the data, and analyzed it manually or with a certain coding software (Caplena 😀). Now you know what you have got to do to improve the business or the customer experience. And it’s all thanks to the open-ended feedback from your customers….. Oh wait, you didn’t do it yet? Well, why not? Today, we will take a look at three reasons why open-ended feedback is vital for you and your business, and why you SHOULD collect open-ended feedback.
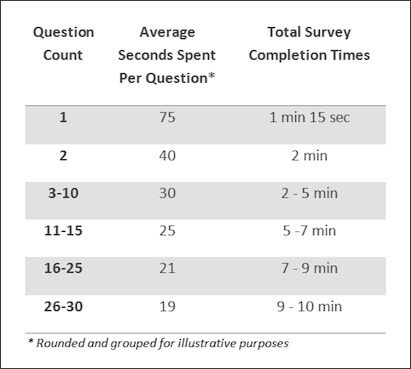
Let the people talk! Collecting open-ended feedback from your customers offers quality responses as it enables customers to focus on the question and share their opinion in an honest manner without having to conform to pre-selected answers which may not offer the best response. We propose asking only 2 questions in any survey to get honest and more thought-provoking insights. Hold up… why only 2 questions? Let’s look at a recent study conducted by SurveyMonkey. The online survey tool has found that asking fewer questions could be the difference between respondents spending over 1 minute on a question or less than 20 seconds. Thus, having a survey with very few questions may lead to better-quality responses as you gain deeper, more accurate customer insight! 💫
One of the biggest issues with multiple-choice questionnaires is that you, as a surveyor, assume the ideas of the respondent and that this assumption might omit an important answer. So, even when conducted in the correct conditions, confining your survey respondents to pre-selected answers may lead to inaccurate feedback. Respondents may attempt to fill in an answer which is slightly related to their ideas and thoughts but it may miss a crucial element of their response and may not pinpoint their true feelings. As well as receiving inaccurate information from this type of feedback, you may also lose the opportunity to hear new ideas or suggestions to improve your product or service as the respondent’s voice is lost in the limited choices. Open-ended feedback reduces inaccurate information and enables the respondent to say what they want to say (Whether you like it or not!) 🕵️
Without knowing what your customers think of your product or service, you create a business blind spot for yourself. Business blind spots are dangerous as without understanding what your customers’ wants and needs are, you cannot provide the best experience to your customer, and if you cannot provide the best experience to your customer, your customer will become someone else’s. To avoid this scenario you need to listen to your customer and the best way to do this is to ask them openly: How was your customer experience? How can we improve your experience? What ideas do you think we should consider? By asking your respondents broad, open questions you allow them to spill the beans on what they like about your business, what annoys them, and in some cases, solutions to current problems! 🤝

Image by Tumisu from Pixabay
In summary, open-ended feedback leads to quality responses, reduces inaccurate information, and improves your business overall. We understand that collecting this information is not the hard part and that the real issue is finding time to analyze the collected open-ended feedback. You could do this manually which may take some time if you have more than 100 survey responses. You could also try Caplena, the market-leading text analysis tool!
Unless you are a psychopath, humans are by nature emotional beings. Anger, sadness, happiness, and love are emotions that almost every human has felt. Nowadays, we have a plethora of emotional AI detection methods at hand. Sentiment analysis is one of the most widely used methods, with 59% of companies using sentiment analysis to improve their customers’ experience, according to Bain & Company. But what is sentiment analysis? Today we will look behind the fancy marketing gimmicks and get straight to the core of sentiment analysis and why Caplena’s stands out from the rest.
Sentiment analysis is a natural language processing (NLP) technique used to determine whether data has a positive, negative or neutral sentiment. In short: Sentiment analysis looks at the emotion expressed in text. For example, businesses can use this to monitor brand and product sentiment in customer feedback. Feedback of this type usually takes the form of textual data, such as reviews or responses to surveys.

When we examine emotion in academia, we often see circles like the one above that show various emotional options. However, it is challenging – even for people – to make precise statements as to what kind of emotions are prevalent in a given text. As a result, there is a significant disparity between what different people attribute to the same text. To illustrate this point, we had eight people decide which emotion to assign to a given text out of eight options.
💡 The results -> contestants chose four emotions overall, not just one.
This shows a 75% perceptive discrepancy from choosing just one answer. Crazy, isn’t it?

As we can now see, even humans are incapable of determining complex emotional subtleties without images or audio. It is not recommended to classify into detailed emotions such as hate, sadness, or joy – this would be too inaccurate.
➡️ Through sentiment analysis we can see the polarity of texts and whether they are positive, negative, or neutral. There are two main types of sentiment analysis:

Here we assign a positive, negative, or neutral sentiment towards an entire text, meaning a whole sentence – or paragraph. How can we use this? On the verbatim level, using an aggregated approach is recommended, so looking at 100s or 1000s of texts and saying that 30% had a negative sentiment, for example. A verbatim-level sentiment analysis may be appropriate for practices such as social listening. Typical tweets, for example, are short and have only one sentiment per sentence. For types of text that show only one emotion, verbatim-level sentiment analysis is sufficient.
➡️ In reality, however, most sentences contain more than one sentiment. Customer feedback and customer reviews are good examples of this. As a result, verbatim-level sentiment analysis can quickly become inaccurate. Assigning a single sentiment to a given sentence becomes problematic if the sentence has more than one sentiment; which leads us to the second type:

A more advanced version of verbatim-level sentiment analysis is topic-level sentiment analysis (also used by Caplena). Here we classify the sentiment toward a specific topic of the sentence (e.g price and service.) As shown in the example above, statements with mixed sentiments are very common in customer feedback.
Most humans would agree that it is hard to decide on just one sentiment for the above sentence. But if this was a verbatim level sentiment analysis – you would have to choose. Would negative and positive cancel each other out and make a neutral? Would it appear to be more positive than negative?
This is our humble opinion → why force a conclusion based on just one sentiment, when a sentence clearly contains multiple? This is why Caplena offers ️🔥sentiment analysis on the topic level️🔥 rather than verbatim level – because it is simply more accurate.
Topic-level sentiment analysis more accurately presents aggregated analysis findings and provides topic-level action-taking potential. If you know that 20% of your customers were unhappy with the price of your service, you could reach out to each of them specifically to offer a discount, for instance.
Starting in the 2000’s
Determining sentiment 100% reliably and automatically is still a holy grail of text analysis. But we’re getting closer. In the past, lexicons have been used, such as SentimentWortschatz, which assigns a value between -1 and 1 to each word. The word “crash” gets a value of -0.47, while wonderful gets +0.72. By adding up the values of each word in a sentence, we get a total value that announces which sentiment prevails. This works for simple statements but fails for negations because it ignores the interplay between words. The 2000s saw several attempts to address this issue, but none could account for context. The real *boom* of sentiment analysis came only within the last decade.
2010 – Present | How Sesame Street Saved Machine Learning
Artificial intelligence, deep learning, and transformers have fundamentally changed this context issue in the last decade. It began with BERT, the character of Sesame Street – short for Bidirectional Encoder Representations from Transformers. For the first time, BERT took context into account by giving the AI many simple tasks on millions of Internet text documents. One of these tasks was to reconstruct randomly deleted words from texts. With practice, the AI gets better at guessing which word is missing from the gap, which is how machines learn context.

Since BERT, many improvements have been made based on this, such as RoBERTa and ALBERT. One thing is clear: AI’s are becoming more complex and trained on more data, making it more difficult and expensive to build an AI from scratch. Most companies use commercial AI providers or open-source libraries. Very few perform automatic sentiment analysis on user-defined aspects (with Caplena being one of them). Some solutions additionally offer fine-tuning of the AI significantly improving the accuracy for the specific industry and question. The fine-tuning process involves manually reviewing a few sentiment assignments or injecting additional rules.

Sarcasm is difficult to interpret even with the best systems. The primary difficulty is that sarcasm is very context-dependent. Let’s look at some examples of how Caplena’s AI categorizes the following statements:

As it turns out, our system has correctly inferred 3/4 of the cases (all but the last). What’s the takeaway?
Where does this lead us in terms of the overall analysis?
Customer surveys are undoubtedly valuable to your business. They produce rich, valuable insights into loyalty and satisfaction, provide actionable feedback to improve your product or service and help build a relationship with your customer base. That being said, surveys come with their own set of challenges, including accurate text analysis.
Let’s rewind for a minute and walk through what a typical customer survey might look like for your business. If you’re looking to gain insight into customer satisfaction or loyalty, you might seek to gather a measurable metric accompanied by open-ended feedback– such as NPS (net promoter score) or CSAT (customer satisfaction).
If you choose to send a net promoter score survey, for example, your survey may ask customers, How likely are you to recommend Brand X to a friend, coworker, or family member? Please provide a rating on a scale of 0-10, 0 being extremely unlikely and 10 being extremely likely.
This question will be followed up by an opportunity for respondents to explain their rating: Please explain your rating.
Then, you’ll place your respondents into three categories: Promoters (rating of 9 or 10), Passives (7 or 8), and Detractors (6 or below). After calculating your score (% of promoters - % of detractors = NPS),
you’re now faced with the task of evaluating feedback: the open-ended text that expresses the thoughts, opinions, and advice of your customers.
Here’s where the challenge begins–accurately analyzing what your customers had to say, and producing actionable insights.
Of course, you could rely on a human being to perform text analysis. In theory, a human could accurately run through hundreds (or thousands) of open-ended responses to identify common themes and evaluate various sentiments.

The glaring issue with this approach is, of course, the fact that this takes an enormous amount of time (and money) to achieve. It’s slow, tedious, and meticulous work to pick through each individual response. And depending on the size of your customer base, this could take days or even weeks to accomplish successfully.
The second issue with human analysis is that humans are susceptible to fatigue and inconsistency. For example, a human coder might evaluate the phrase “I don’t care for product X” as extremely negative in one instance, but a few hours later, decide that this same phrase only connotes mild negativity.
In any case, human analysis isn’t ideal.
Your second option is to use conventional algorithms to evaluate open-ended feedback. In theory, an algorithm can perform the work of analysis for you and applies consistent intelligence to produce consistent results.
Conventional algorithms, however, often lack the type of intelligence required to evaluate the following:
That being the case, a conventional algorithm may produce some basic feedback for you…but don’t count on it being accurate. 😕
Unlike a conventional algorithm, state-of-the-art sentiment analysis relies on a machine-based learning system to evaluate open-ended text.
The difference lies in the system’s ability to accurately analyze the commentary of the survey-taker (i.e. The quality of the product is great, but customer service is terrible).
The right kind of sentiment analysis empowers you to accurately capture both positive and negative sentiments around various topics. In short, it allows you to really understand “what was good” and “what was bad”.
A sentiment analysis that takes an aspect approach gives you the richest type of insight. How so? An aspect approach understands sub-themes – not just overall sentiment.
An answer-level approach assesses the single mood of a response. But aspect-level sentiment analysis can assess multiple sentiments–or themes–within a single response.
Not only that, but a user can define different sub-themes he or she would like to identify in the feedback by creating polarized codes.
Some aspects of your product or service, such as billing, may simply be positive or negative. If a customer doesn’t appreciate your pricing, the sentiment won’t be very complex.
But other aspects of your business may carry multiple connotations. Customer Service, for example, may produce a range of emotions in your customers. Sub-themes such as “competent/incompetent,” “friendly/unfriendly,” and “knowledgeable/lack of knowledge” can be understood by sentiment analysis that takes an aspect approach, but may not be picked up by sentiment analysis that picks up on the overall mood.
Furthermore, customers might mention specific brand names in their feedback. If a customer is comparing you to a competitor, you’ll want to be able to identify the theme. Are you being compared positively or negatively? Are they drawing similarities, or wishing you offered a comparable service or product?
In any case, state-of-the-art sentiment analysis can help you quickly understand the emotions of your client base and ultimately, give you the accurate, actionable insight you need to improve your business and generate more enthusiastic customers.
Caplena is an A.I.-powered software that can offer you the kind of detailed, accurate insight you need from any type of open-ended feedback. Caplena’s state-of-the-art sentiment analysis is founded on a deep, transformer-based neural network that has been trained on big data and fine-tuned on domain-specific data. It operates on individual sub-words (“word-pieces”) to accurately evaluate a text. In other words, it takes the powerful aspect approach described above.
Caplena can help you:
How’d you like this article? Our team will be happy to include your suggestions in future blog posts! Just email our Head of Marketing sheila [at ] caplena.com
Other Useful Links:
Sentiment and Emotion Analysis for Beginners: Types and Challenges
Did you ever get burned by a hot object as a child and vow never to make the same mistake again? That was a critical moment of learning. Through a variety of experiences, we develop and become better at navigating the world around us. In addition to humans, this ability is also possessed by animals, plants (yes, really), and, most recently, Machines 🤖. There is a lot of marketing buzz surrounding Machine Learning, Deep Learning, and Artificial Intelligence – and a lot of nonsense. Our aim is to help you make sense of these terms with this article. So let’s get to it! 🚀

Let us begin with a generic term, one that has been around for a long time: Artificial Intelligence (AI).
AI describes the ability of a machine to interpret and respond to inputs in an intelligent way. This discipline is decades old, with the first research stemming from the 1950s. Over time AI had its ups and downs – ‘winters,’ where it was deemed a dead discipline, and summers where every ice-cream shop thought it needed to jump on the bandwagon 🚎. The most recent AI hype is mostly due to a specific method within the AI universe: Machine Learning.
Machine Learning Algorithms rely on data instead of specific rules to make their decisions. You have most probably applied a Machine Learning algorithm yourself already, even before it became ‘hip’. We’re talking about linear regression (or more colloquial “line-fitting”): Fitting a curve to best describe some (dirty) data. This is a two-parameter Machine Learning model.

Obviously, a lot of the problems we want to solve are not describable with such a simple linear relationship. That’s where Neural Networks and Deep Learning (DL) come into play.
Neural Networks are a subset of Machine Learning algorithms. They have been around since the dawn of AI – some 70 years ago! But while they have lived the destiny of sleeping beauty 👸 💤 for most of their existence, in recent years they have risen to power and been at the core of the most recent AI frenzy.
Neural networks are loosely modeled after the human brain 🧠 with neurons propagating information forward, often over multiple “layers”. Stacking a lot of these layers onto each other is then called ‘Deep Learning’. The power of these massive networks, which often have 100s of millions of trainable weights (as opposed to the two weights of linear regression) is that they can model – and thus – learn almost any logic.
Let’s illustrate the differences with a concrete example: Sentiment Analysis.
Problem Statement: We want our software to classify the sentences we provide it with into “Positive”, “Neutral” and “Negative”.
By the way: This widely used method is part of the “Natural language processing” domain, a class of algorithms that deals with human language (either written or oral). Natural language processing is a subset of the AI family. Learn more about NLP here.
A simple rule-based system (which counts as AI as well) might have a list of words that count as “positive” or “negative”. For example, it might say that sentences containing the words “Good”, Great” and “Happy,” should be considered to be “Positive”. However, just adding the word “Not” before one of these positive indicators changes the sentiment entirely. So you would have to implement some more logic that if any of the “Positive” words are preceded by “Not” the sentiment is inversed. But what about the sentence “Great service. Not.” Further rules would be needed to cover this case as well. As you can see it is a daunting and never-ending task to dissect language based on fixed rules.
That’s why most of today’s cutting-edge sentiment analysis tools rely on Machine Learning: Instead of defining which words mean what, you show the algorithm a large number of examples, from which it will deduct the rules on what is positive and negative itself. How does that work concretely? Let’s look at one training step:
By repeating this over and over again, showing the system 100’000+ examples of its internal rules will become a better and better model of our language. The goal is to get the model to generalize well, meaning its internal rules actually capture the essence of what we want it to understand and not capture some spurious correlation.
Caplena uses advanced Machine Learning models like Transformers to detect topics in your data, do sentiment analysis and classify text comments into various categories. But how is it that you can customize the topics you want without, or, only very few training examples, as opposed to the 100,000+ examples mentioned above? The answer to this includes Pre-Training, Transfer Learning, and Augmented Intelligence. But those are topics for a next time 😊
Useful Links:
Are you a developer beginning Machine Learning? Click here for a useful beginner-level blog.
Does AutoML work for Diverse Tasks?
Who is responsible when AI is irresponsible?
Video Walkthrough: Text Analysis of Netflix App Reviews
This tutorial is all about Netflix! 👨🎨: We’ll take you through every step required to evaluate your open texts with the help of AI. If you follow the 3 required steps described in the guide below in all detail, it will take you approximately 45 minutes to get to achieve these results.
The basic principle when having to evaluate free text is called coding: Coding is the process of assigning one or more codes (tags or topics) to every text element.

Example: Two codes are assigned to this piece of user feedback.
When you have assigned codes to a majority or even all of your text elements, you can create statistics, charts such as treemaps, and dashboards, describing your results:

Now, these steps can of course be done manually in Excel or some other coding software. It even should be done there if you have, say, only 50 text elements. But if you have 200, this becomes unpractical – if you have 5000 borderline impossible.
That’s why the following guide helps you eliminate most of the tedious work associated with the analysis of open-ends. And enables you to spend more time & thought on the task which actually requires your problem apprehension and insights: Making sense of the results.
The first step is obviously getting your hands on the data. How this is accomplished depends on what you are working on: Ask your clients for feedback, send out an NPS survey or scrape the web for social media posts or product reviews.
In this tutorial, we will use 5,000 feedback responses about the Netflix 🍿 app from the Google Playstore.
As you might have guessed, we’re going to use Caplena to evaluate the data. We might be slightly biased here, but we’re pretty sure this is the hottest text-analysis tool currently out there 😉.
Caplena’s latest integration feature allows you to simply copy and paste the Google Playstore link – and you’re done!
| Required Time | 1 minute |
| Time-saving compared to the manual approach | None |
| Required brainpower | 🧠 out of 🧠🧠🧠🧠🧠 |
Find out more about the integration feature here and register for a free trial here.
The result of this step is a codebook, i.e. a list of codes (tags) that should be attached to the texts. Codes are topics, themes, or concepts that are higher level than keywords. Keywords, as other tools deliver them, might be Service or price. Codes on Caplena look like this:

Codes are high-level concepts and can include sentiment, either explicitly (example #1) or implicitly (example #3).
See how “Service” can mean two different things in different codes – making them much more powerful than keywords.
The process on Caplena is a prime example of augmented intelligence: Our algorithm detects topics, but your industry knowledge and abstraction capabilities are required to improve organization & clustering.
| Required Time | 5-15 minutes |
| Time-saving compared to the manual approach | 75 – 95% |
| Required brainpower | 🧠🧠🧠 out of 🧠🧠🧠🧠🧠 |
After the previous step, you have a codebook and the AI has assigned a code to every review where it thought it made sense. And it only took a couple of minutes.

If we want to, we can now fine-tune the AI. The purpose of fine-tuning can be:
| Required Time | 15-75 minutes |
| Time-saving compared to the manual approach | 30 – 95% depending on the data size |
| Required brainpower | 🧠🧠 out of 🧠🧠🧠🧠🧠 |
Now that we have organized our unstructured text into structured categories, we can start making sense of the feedback. For this purpose, Caplena features a visualization module, which enables you to easily create charts and dashboards, which you can either download or share with your team/clients directly through a shareable link.
Check out this Netflix demo dashboard.
It took us less than 15 minutes to create.
Although the mechanics of creating bar, pie, line, treemap, or graph charts on Caplena are very simple, making real sense of your data is not. Distilling the relevant essences from the data and telling a compelling story with a few words and a handful of charts is the most crucial part of any analysis. It is also where you should invest most of your brainpower.
| Required Time | 5-90 minutes |
| Time-saving compared to the Excel approach | 50 – 90% |
| Required brainpower | 🧠🧠🧠🧠 out of 🧠🧠🧠🧠🧠 |
The process from the moment you have your open-ended text in Excel, to showcasing your results in an interactive dashboard can be completed within as little as 25 minutes. It is all about making use of today’s technologies in the most efficient way while spending your time on the things that machine learning cannot automate – like making sense of the results.
Humans are not perfect at categorizing text. They make errors. They’re biased. And they develop inconsistencies. Artificial intelligence can help fill in the gaps left by human fallacy, but AI can differ in quality, too. As a result, anyone looking to use artificial intelligence to help analyze their open-ended text should first assess what kind of AI will produce the best results.
In this article, we’ll take a look at a) why humans produce better results when partnering with AI (than they would on their own), and b) how to assess different types of artificial intelligence to get the richest, most actionable insight from your open-ended feedback.
Open-ended questions yield immensely valuable feedback for market research or insight into customer behavior.
For example, let’s say that a company wants to get more insight into how it’s perceived versus how its competitors are perceived. To gain this sort of insight, respondents are asked to score this company and the competition using multiple NPS surveys. To capture the extreme breadth of areas in which their competitors might differentiate themselves, and to analyze feedback as unbiased as possible, ratings are followed up by an open-ended question – Can you explain your rating?
The resulting feedback allows the company to gain a granular and consistent analysis of feedback…and ultimately, uncover the true drivers of customer satisfaction.
The challenge here is, of course, assessing the open-ended feedback. Let’s say this company surveyed 2,000 respondents and asked about 12 different competitors. That yields 24k open-ends. 😯
What would taking a manual, human-centered approach look like in this context? Every answer must be read, interpreted, and tagged with relevant topics and sub-topics (which aren’t determined before coding begins).
What’s the problem with this kind of approach?
The human-centered analysis is:
Finally, and most importantly, it’s not the most accurate approach.

Typically, humans excel at interpreting a text. However, they are susceptible to making significant errors for the following reasons:
So, what’s the solution? How can we efficiently analyze open-ended texts with accuracy and natural human insight?
By partnering artificial intelligence with human intelligence, you resolve human errors in analysis–and still, get rich human insight.
As mentioned above, however, AIs differ in quality. Ideally, they should be compared and assessed to choose a text-analysis tool that will produce the best results.
To compare different feedback tools, testers can feed a sample of responses, including their assigned codes, to a system of different types of AI in a supervised classification regime. The AI will then learn and apply the coding to a new dataset, allowing the tester to verify each analysis tool’s level of accuracy.
However, accuracy is not a sufficient measure of quality.
Accuracy is simply the number of correct samples as a percentage of all samples. But as texts can have one or more codes, most software will count every instance of the code being correctly assigned or not assigned as a sample.
For example: When we have a codebook with four codes, each response should include one of these. But if the AI algorithm assigns no code, this still counts as being 75% correct (as three codes have correctly been not assigned).
Datasets are nearly always unbalanced when tagging texts, as codes are typically not present at a much higher rate than being present. The result? A ridiculously high (and inaccurate) level of accuracy–usually above 98%.
To find a text-analysis AI tool to produce consistent results, you can use the scientific accuracy metric F1. F1 is the harmonic mean of precision and recall, both metrics providing information about the quality of a classification engine.
Here’s how it works:
Precision answers the question “How many assigned codes are relevant?” It is calculated by dividing the amount of correctly assigned codes by the total amount of assigned codes.
Recall answers the question “How many of the codes would be correct, did the AI select?” It is calculated by dividing the amount of correctly assigned codes by the total amount of all codes that could have been assigned.
What’s a good score for either standard?
Theoretically, precision and recall can reach 100…but this score is never reached.
Instead, you’ll want to consider the following benchmarks:
In the end, the F1 score is stricter and more unforgiving than measuring accuracy alone. As a result, it’s a more laser-specific tool for comparing different AI text analysis tools, as well as comparing AI tools against human coding.
What have field tests with clients shown?
– AI solutions make coding faster
– AI solutions make coding less expensive
– And finally, AI solutions produce more quality, consistent results
The F1 score has also been found to be a very good indicator of the quality of the codebook being used. Automated open-end coding can help to build more meaningful codebooks by pointing out ambiguous and imprecise codes. Often, low F1 scores tend to reveal codebooks that are too large with too many codes – making it difficult to distinguish codes (for both machine learning and humans).
The right text-analysis tools can not only increase cost-effectiveness but also ensure unparalleled quality in coding consistency. Combining advanced AI with human skills creates a scalable system for open-end coding. It also produces a more consistent, accurate analysis with less effort.
Finally, an automated text-analysis tool gives the human coder more time to fine-tune the codebook, create highly relevant codes as well as spend more time deriving insights.
If you’re looking to gain rich, accurate insight from your open-ended feedback, Caplena offers you a cost-effective tool that offers the best of both artificial and human intelligence. The result? You gain rich, detailed insight to use for market research, client behavior analysis, and more.
Trackers provide a strategy for collecting valuable input and data over time for your business. By tracking the evolution of KPIs and open-ended feedback on your business, you gain valuable insight into how your customers feel about your product or service, what you could be doing to make improvements, and more.
That being said, evaluating tracker feedback can be time-consuming and tedious – especially when it comes to assessing open-ended feedback. In this article, we’ll take a look at why you should use trackers and how to automate trackers for optimal efficiency and performance.
An ad-hoc approach to gathering intel about your business generally means that you wait until necessary to deploy a survey. For example, you may see that your churn rate is quickly increasing, so you quickly design and implement a CX-focused survey. It’s a reactive rather than a proactive approach to ensuring high satisfaction and retention.
Trackers, on the other hand, are used regularly to collect data about a product or service. The advantage of this kind of approach is that you act both proactively and reactively – taking consistent steps to ensure high retention & loyalty as well as responding to key feedback analysis and insights to make improvements.
Trackers are most effective when following pre-defined KPIs (Key Performance Indicators), upon which the business relies to achieve its targets. Popular examples are:
The intelligence to populate these KPIs can stem from various data sources. Some examples are:
Trackers have been found extremely valuable when collecting data from unbiased survey formats such as open-ended questions. These formats produce authentic responses from customers who are interested in sharing their thoughts, opinions, and actionable insights. By assessing this feedback over time, you’re able to identify and detect issues related to customer experience and satisfaction and put those issues into perspective.
For example, are these ongoing issues, or one-time incidents? Identifying trends in your open-ended feedback will give you insight into what kind of strategies will be most effective and productive in terms of boosting customer satisfaction and loyalty.
The trackers seem to be good. Trackers based on open-ended answers seem even better. Why is not everyone using them? The reason some businesses have decided not to pursue this kind of market research has often been historic price & time. Analyzing these large amounts of data on a regular basis, especially if the data stems from open-ends, used to be expensive and used to take too much time to generate actionable insights.
The good news is that the latest developments in artificial intelligence (AI) have been able to lower these expenses substantially. There are a lot of businesses that have now realized the potential to install trackers and actively rely on them for market intelligence.
Coop, the largest Switzerland-based retailer with over 2.5 million members conducts sentiment analysis over time to generate insights around specific topics and changes. When Coop implemented a design change to its store, the retailer was able to collect data to measure the impact on customer satisfaction. The result was a success: Coop noted an increase in satisfaction with the store atmosphere from 5% to 9%. That 4% increase may be the difference between retaining and losing a customer. Gathering this intel helped Coop gain insight into how successful their efforts were, and how to move forward in the future.
AI algorithms can automate trackers to help give you fast, accurate insight without needing to perform the full analysis yourself. AI can “learn” how to best assess your feedback, adapting with increasing accuracy with each new wave of feedback. In fact, AI will deliver you better quality analysis than you could have produced yourself. Automated analysis is far more consistent than human analysis because it adheres to an inexhaustible coding algorithm. Ultimately, automating large-scale trackers may even produce brand-new insights that could have been missed by human eyes.
At the end of the day, automating trackers is a far more efficient, convenient system for gaining insight than sifting through feedback yourself to identify trends and categorize responses. You save significantly on time and money – gaining more resources to focus on making improvements and developing actionable, responsive strategies to feedback.
By now, you know that automating trackers is a valuable strategy for creating a more efficient, accurate system for gleaning insight for your business. Automating trackers can help you to react quickly and responsively to new trends and customer feedback. That all sounds great, you might say. But how do you do it? 🤔
To effectively automate trackers, you’ll need to create a codebook – a collection of topics, where topics might have one or more sub-topics or codes. These codes are used to interpret the feedback, helping you to quickly and accurately identify common themes on a conceptual level. Your codebook will evolve as artificial intelligence learns how to make more accurate assessments of your trackers.
There are several different strategies for creating an initial codebook:
The key to refining your codebook – allowing you to get better results – is time.
After the first wave of feedback, your codebook becomes more and more accurate. With each new influx of feedback, artificial intelligence begins to learn, adapt and apply a more accurate analysis. This generates consistent assessment and gives you better insight into topics over time. Artificial intelligence will also intelligently respond to new topics that pop up with each new wave of feedback, working to give you insight into new trends, opinions, or issues.
Data visualizations, such as the one below, can help you better understand your data. Creating a chart that shows the growth of specific topics over time is a valuable strategy for responding to big-picture growth–and seeing how changes have impacted customer satisfaction, customer loyalty, retention, and more. For example, we’re a big fan of the driver chart to discover customers’ main pain points!
Once you’ve created a system for automating trackers, you’re ready to lean back and enjoy the ongoing, accurate analysis. Whether you use a tracker to evaluate Net Promoter Score, CSAT, retention, social media data, or another metric or source of information, an automated tracker will give you the insight to improve your product or service, boost customer satisfaction, and build a stronger business.
Caplena uses a combination of artificial intelligence and human intelligence to help you automate trackers, deploy powerful surveys, and accurately assess open-ended feedback with NLP (natural language processing). It’s a powerful way to deliver you valuable insight–and save you time, money, and effort.
What do customers think about organic food? What do they like about the newly built store? Why do some customers feel 😊, while others feel 😩 ? These are questions that Coop, the Swiss Retailer wanted to find out!
Asking customers open questions leads to the most effective results. But the real question is how to analyze thousands of open answers in the most effective way?

Caplena analyzes 50,000 open feedbacks for Coop, quarterly. Its cutting-edge machine learning software creates an unparalleled depth of insights. Understanding the drivers behind customer loyalty and satisfaction enables Coop not only to improve its products and services but also to draw conclusions about its strategy and goals.
Sorting through feedback from customer surveys is no simple task. You must organize, assess, filter, and understand the transcribed thoughts and opinions of your customers, spelling errors, etc. But for companies with particularly large customer bases, the analysis of mass feedback is a particular challenge.
Large retailers, for example, might collect tens of thousands of customer surveys each quarter. These surveys might ask customers about how they feel in the store, how they are treated by employees, and what they think about a store’s pricing, quality, availability of new products, and more. In any case, survey questions can range wildly. Factor in the likelihood of thousands of customers using different terminology and talking about different products, and you have a wide range of possibilities on your hands.
Not to mention that even medium-sized retailers are strapped for time and resources – making the task of effective analysis challenging at best, near impossible at worst.
However, analysis of mass feedback can be performed efficiently and accurately, given the right tools and strategies. The result? Insights that help businesses measure impact, assess customer satisfaction/loyalty, and make significant improvements. Here’s how one major retailer in Switzerland was able to efficiently assess mass feedback from a customer survey.
Coop is a Switzerland-based retail and wholesale chain that dates back 150 years to when it was just a tiny co-op. Today, Coop has more than 2.5 million members, operates approximately 2,300 locations, and employs more than 90,000 people. In fact, Coop is so large that it’s responsible for the sales of more than half of all organic food in Switzerland. It has even been called the “World’s Most Sustainable Retailer” – selling a variety of products, textiles, and food that are deemed sustainable.

Needless to say, Coop is large, powerful, and clearly successful. Still, this chain demands lots of customer feedback to optimize operations, adopt best practices, and most importantly, continue to please its massive customer base.
Because Coop is so large, it procures an enormous quantity of customer feedback every business quarter: feedback generated from 50,000 surveys collected at various locations. Traditionally, Coop has left the analysis of survey feedback to individual branch managers, without much oversight. Coop has continued to gather valuable feedback but has simply lacked the time, resources, and processes to analyze that feedback in the most effective way possible.
Other potential solutions? Coop could simply shelve the feedback and wait for a free moment (yeah, right 😏 ). Or, the brand could pick out a small selection of feedback to analyze manually, but that wouldn’t give accurate insight into common trends or themes, or show rates of improvement over time. Or, it could look for a strategic solution that would help to successfully analyze their feedback, take advantage of customer insight, and make improvements to boost customer satisfaction and loyalty (and profits).
To find a solution for processing customer feedback on behalf of Coop, Swiss Market Research Institute LINK found Caplena – a natural language processing (NLP) coding software that uses augmented intelligence to effectively analyze customer feedback without tedious manual work. Here were the results of Coop and Caplena’s game-changing partnership:
Caplena uses machine learning to auto-complete the analysis of feedback so that humans don’t have to.
Now, Coop has the ability to handle its 50,000 pieces of feedback every quarter in a manner that’s timely and efficient. After all, feedback that was given even six months ago can become quickly irrelevant. For example, a new product can bring in a whole new subset of customers. Changes to various store locations can significantly impact customer satisfaction. Seasonality may also affect customer feedback. For example, the holiday season will most likely raise sales and points of contact with the customer.
With Caplena, Coop can now respond to feedback rapidly, measuring up-to-date levels of customer loyalty. This timely insight also allows them to measure the impact of various business decisions on overall customer loyalty.
Caplena uses augmented intelligence to effectively code feedback responses, making them organized, clear, and actionable. The Natural Language Processing (NLP) technology developed by Caplena is able to understand and identify the natural human language, even with misspellings, slang, and different forms of the same word.
To effectively address misspellings, Caplena processes on a syllable level instead of the “mostly used” word level.
Because Caplena uses an advanced A.I. that has “learned” from a vast amount of industries and a vast amount of feedback, it has an advanced understanding of general speech that gives it “human-like” capabilities. For example, the German word for “fresh” can mean either “fresh” as in “freshly-baked,” or “fresh” as in “cool” (temperature-wise). When a customer says, “The bread is fresh,” Caplena knows that it means “freshly baked.” And when a customer says, “It’s too ‘fresh’ for me in the store,” Caplena knows it means “cold.”
“We could barely distinguish between human and automatic coding. The system really understands our customers’ answers,” said Coop.
Using Caplena provided by LINK, Coop was able to measure an increase in customer satisfaction with the store atmosphere. “The increase from 5% to 9% was so large that we were able to rate the implementation of new store design as a complete success,” according to Johanna Mäder, Market Research Project Manager at Coop.
Departments within Coop that were already close to the customers, such as customer management or marketing, moved even closer to their customers.
Caplena’s automatic coding simplifies the distribution of open-ended responses, making customer feedback and insights more accessible to the entire company. The result is deeper insight across multiple departments, potentially producing improved practices for the entire corporation.

Working with Caplena for the first time, Coop said, “The team closely supported us throughout the entire process so that we were able to complete the project… within just two weeks.”
“Effectively translating the ever-increasing amount of feedback into actionable insights is a major challenge for us. In our toolbox, Caplena is an important analytics tool that enables us to benefit from the new possibilities of digitization.”
Surveys that give customers an opportunity to provide open-ended feedback offer unparalleled insight into customer loyalty and satisfaction. Open-ended feedback also helps build valuable relationships with customers by showing them that you value their thoughts and opinions.
Caplena uses an advanced form of augmented intelligence to effectively code open-ended responses and turn feedback into actionable insight. Using Caplena, you’ll be able to filter and organize customer responses into valuable categories, such as “Pricing Positive,” “Customer Service Negative,” or “Usability Positive” – all without manual work.
As a business owner, you simply can’t overestimate the importance of what your customers think, feel, and say about your product or service. Most likely, you already know the key to discovering this invaluable information: A customer survey.
Customer surveys allow you to reach out to your customer base, probe them for their thoughts and opinions (in a friendly way, of course 😊), and filter their feedback for common trends and themes. The resulting insight can help you improve your product, make better business decisions, and convert more of your customers into vocal, enthusiastic advocates for your brand. Sounds good to us!
The trouble is, how do you decide on what kind of survey to use? With a seemingly endless variety of formats and question types, it’s difficult to know where to begin for the best results.
In this article, we’re eliminating some of the guesswork for you by giving you foundational advice to creating an effective customer survey, as well as a good old-fashioned compare-and-contrast between two of the most common survey question: open-ended vs. multiple-choice.
Before deciding how you want to write your customer survey, you need to decide what sort of information you want to collect. If you’re focusing on customer satisfaction, there are several metrics that you can gather. These include CSAT (customer satisfaction score), CES (customer effort score), and finally, NPS (net promoter score).
While CSAT focuses on measuring general rates of customer satisfaction, CES seeks to gather information about how challenging it is for customers to interact with your product. Both of these metrics can be valuable in their own right, but what you’ll really want to focus on is NPS.
Why?
NPS effectively captures a spectrum of customer satisfaction-related insights by asking your customers how likely they are to recommend you to a friend, relative, or coworker. In doing so, they let you know how happy they are and how usable your product is. Maybe most importantly, you also gain insight into your success in encouraging word-of-mouth marketing.
NPS is generally collected by asking, “How likely are you to recommend Product X to a friend, relative, or coworker?”
Survey-takers then have the opportunity to respond on a scale of 0-10. Customers who give you a 9 or 10 are promoters; customers who give you a 7 or 8 are passives, or neutral, and customers who give you a 6 or below are detractors.
In a perfect world, all your customers would be promoters, eagerly sharing the good news of your product with others. But that’s not usually the case. In all likelihood, you’ll find more of a combination of customer types. Your goal is to discover why promoters love you, and why detractors are less than satisfied. And then, you’ll want to turn that feedback into actionable advice.
Your follow-up question is the key to turning insight into action.

If someone gives you an enthusiastic “10,” you can take a guess about why they love your product…but in reality, you need to hear from your audience to get an authentic answer. On the flip side, if a survey-taker gives you a “4,” you’ll most likely be desperate to understand the logic behind their less-than-thrilled answer.
In any case, you need to give them an opportunity to explain.
You can do so in one of two ways: a multiple-choice question, giving survey-takers a pre-set range of options to choose; or an open-ended question, providing them the chance to use their own words to explain their rating choice.
A multiple-choice question for collecting NPS feedback for a meal delivery service might read as follows:
What can we improve on?
a) Customer service
b) Quality of ingredients
c) Package design
d) Recipe instructions
The core advantage of asking a multiple-choice question is that you generate a highly controllable outcome: You receive specific information with very little need for analysis. It’s fast and easy, and can give you some actionable insight.
The disadvantage, however, of asking a multiple-choice question is that you don’t really learn why your customers rated you the way that they did. For example, by asking your customer base the question above, you learn that a number of them don’t like your package design, and very few have complaints about customer service. But did you really learn about their true concerns? You don’t understand your customer’s true sentiment.
Let’s imagine that your detractors’ primary complaints are a slow delivery time or unclear messaging. You haven’t given them an opportunity to share that information. Instead, you’ve made assumptions about the logic behind their rating.
Not only that, but you haven’t created a space to allow your customer base to make suggestions or recommendations. Now you’re missing out on a relationship-building opportunity that shows you value their opinion.
On the other hand, an open-ended question for following up on an NPS rating question might simply read:
Please explain your answer.
Pretty simple, right?

Giving your customers free reign to give you feedback produces some powerful insight. You may discover common threads and trends in your feedback analysis that surprises you, and help you to effectively turn more of your passives into promoters–and your promoters into more active advocates for your brand.
For example, you may learn that many of your customers are unhappy with a particular ingredient that’s present in many of your meal delivery boxes. This ingredient could be killing off your retention rate, and turning your satisfied customers sour.
But without an open-ended question, you would have remained blindly ignorant of your meal delivery faux pas and left to wonder about dropping subscription rates.
Not only that, but an open-ended question gives your customers space to voice their complaints, and shows that you want to listen.
This can help you to develop effective strategies for improving customer loyalty and advocacy.
The primary challenge of using an open-ended question is, of course, analysis.
Open-ended feedback leaves you with a vast amount of information to read, organize, filter, and most importantly, understand. The larger your customer base, the more amplified your challenge. Take into consideration the fact that many of your customers may misspell certain words and use different phrasing for similar sentiments, and you have hours of data sorting on your hands.
Open-ended feedback produces the not-insignificant challenge of analysis. But relying on a multiple-choice question to gain authentic insight into your customer base leaves a lot to be desired…and may ultimately result in wasted time, money, and resources.
The solution looks to augmented intelligence to help you effectively categorize, filter, and analyze open-ended feedback. Caplena helps you deliver NPS surveys and analyze the feedback, getting you detailed, accurate insight without the massive challenge of trying to perform the analysis yourself. Instead, artificial intelligence does the heavy lifting for you, by using NLP (natural language processing) to evaluate language. At the same time, we help create the codebooks ourselves, using human creativity and insight to establish an effective system of categorization.